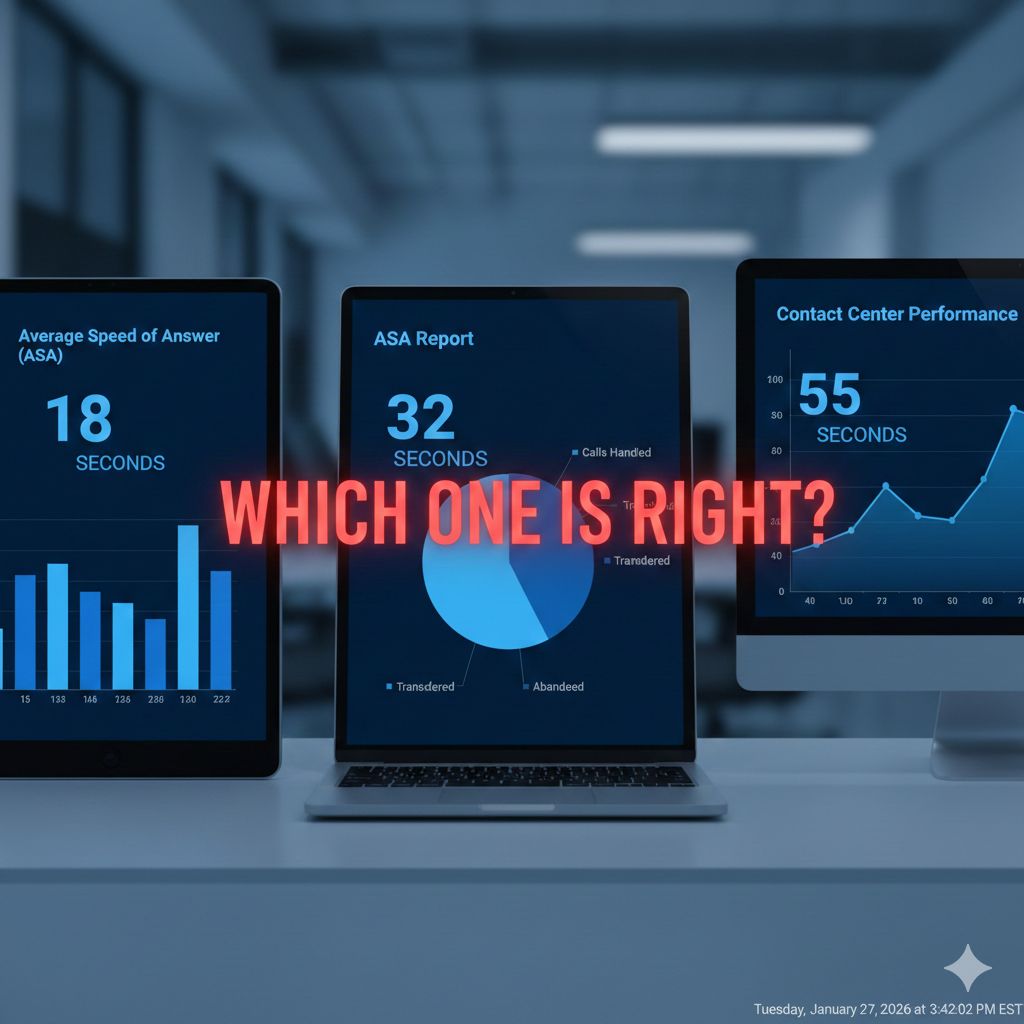
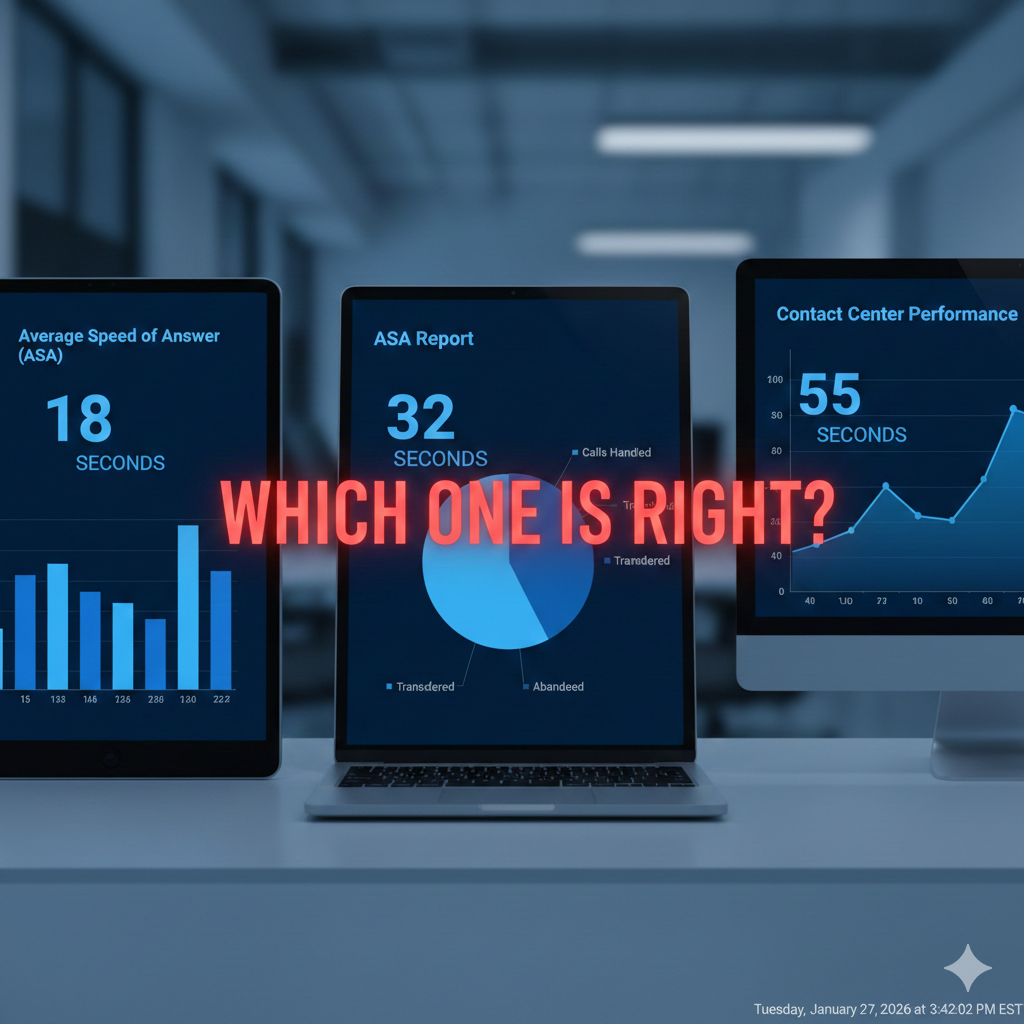
The COO pulled up three dashboards before the Monday call. One showed ASA at 52 seconds. Another reported 61 seconds. A third, sourced from the vendor environment, split the difference at 56. None of them agreed, and none of them were technically wrong. They were simply pulling from different systems with different definitions, different refresh cycles, and different inclusion criteria. The collections and fraud teams had missed recovery targets for three consecutive quarters, and every post-mortem ended the same way: conflicting data made it impossible to pinpoint the real problem.
This is a pattern we see across mid-size and large financial institutions. Data fragmentation is not a technology failure. It is an organizational one. Over time, teams adopt their own tools, vendors build their own reporting layers, and compliance teams maintain parallel spreadsheets. The result is a landscape where nobody has a single, trustworthy view of performance. Decisions get made on incomplete information, and the gaps compound quarter after quarter.
A collections command center solves this by acting as an orchestration layer that sits on top of existing systems rather than replacing them. It does not require ripping out your dialer, your CRM, or your WFM platform. Instead, it consolidates the data those systems produce into a unified operating environment where every metric is calculated the same way, every report draws from the same source, and every stakeholder sees the same numbers.
Days 1-30: One Version of the Truth. The first phase focuses on mapping every system that touches collections and fraud operations. Data feeds from dialers, WFM platforms, vendor environments, and internal databases are consolidated into GOBLIN. Standard definitions are established for every metric: ASA, contact rate, right-party contact rate, promise-to-pay conversion, and recovery rate. By the end of month one, leadership has a single dashboard that tells the truth.
Days 31-60: The Operational Playbook. With clean data flowing, the focus shifts to operational execution. Call-volume forecasts are rebuilt at 30-minute intervals using historical patterns, seasonal trends, and portfolio-level delinquency data. Scheduling is redesigned to match staffing curves to demand curves. Vendor scorecards are standardized so placement decisions are driven by performance data rather than relationship history or contract inertia.
Days 61-90: Automation and Experimentation. Daily dashboard refreshes are automated, eliminating the manual effort that previously consumed analyst hours every morning. Controlled experiments are introduced: A/B tests on contact strategies, channel sequencing, and time-of-day optimization. Every test is measured against a baseline, and results feed back into the operating model within days rather than quarters.
The results at the bank that prompted this roadmap were significant. The staffing gap turned out to be 10%, not the 25% that had been budgeted for new hires. ASA dropped from 57 seconds to under 15 seconds within four months. Vendor costs were reduced by $2.1 million annually by reallocating volume to top-performing partners. Collections losses beat forecast by $1.7 million, and customer satisfaction scores climbed from 67% to over 90%.
For boards and executive teams facing similar challenges, the implication is clear: the answer is rarely more people or more technology. It is better integration of what you already have. A 90-day command center build is not a transformation project. It is a focused execution sprint that delivers measurable outcomes before the next board meeting.